
Google Sheets API Quota: Limits & Best Practices (2026)
A burst of 200 requests in a nightly sync can exhaust a team's google sheets api quota and stop reporting. google sheets api quota is a set of enforced limits that control request rates and daily usage for the Sheets API. This best-practices guide explains how to estimate quota for production, when to request increases, and operational tactics to reduce quota risk. Sheet Gurus API turns Google Sheets into production REST APIs in minutes without backend: sign in with Google, pick a sheet, and get a live CRUD endpoint with real-time sync. It adds API key auth, sheet-level permissions, configurable rate limits, optional Redis caching, and MCP support for AI agents. Explore our getting started guide and quotas benchmarks to see where risk hides.
How do Google Sheets API quotas and limits work?
Google Sheets API quotas split across metrics (reads, writes) and scopes (per-minute, per-100-seconds, per-user, per-project) and vary by endpoint and authentication method. This split means different calls hit different limits, so a burst of read requests can fail even if overall daily usage looks low. Below we reconcile the official quota types with what teams actually run into and show where most projects hit limits first.
Quota types compared 🧾
Quota types differ by metric and scope: per-minute read/write limits, rolling per-100-second per-user windows, and project-level caps each govern different call patterns. Google documents the metrics but real workloads expose practical differences: batch reads count differently than single-row writes, and a service account can act like one heavy user against per-user windows.
| Quota type | Scope | Typical affected calls | Common symptom | Service account vs OAuth client |
|---|---|---|---|---|
| Per-minute read/write | Project | Frequent GETs, batchGet, batchUpdate | Burst 429s during bulk syncs | Both count toward project totals; service accounts aggregate under the same project |
| Per-100-seconds per-user | Per user | Rapid repeated calls from a single credential | Repeated 429s tied to one user or key | Service account counts as one user, so a single service account can hit this quickly |
| Per-user-per-minute (reads/writes) | Per user | Interactive clients, webhooks | Single-user pipelines get throttled while others are fine | OAuth clients map to individual users; quotas isolate them from other users |
| Batch operations | Project and metric | batchGet, batchUpdate, spreadsheets.values.batch* | Higher effective read/write counts than single ops | Batch calls reduce network overhead but still consume metric units |
Use the comparison above to decide whether to optimize "google sheets api limits per user vs per project" by splitting work across credentials or throttling per key. For an actionable planning approach, see our Google Sheets API Pricing and Quotas Guide for capacity planning and quota increase steps.
How to interpret 429, 403, and 400 errors 🔎
A 429 means you exceeded a rate window for a specific metric or scope; check which quota window tripped. Start by confirming whether errors cluster around a single user, IP, or service account. If errors come from a single credential, the per-user rolling window likely caused the 429. If errors appear across many credentials, look at project-level per-minute caps.
A 403 usually indicates permissions, disabled API, or billing/quotas not enabled; verify OAuth scopes, API enablement, and Cloud Console IAM roles. A 400 typically means the request had invalid parameters or malformed data; inspect the request payload and the API response's error.message for field-level guidance.
Short diagnostic checklist:
- Identify the failing endpoint and timestamp range. Check whether failures are simultaneous or staggered.
- Group requests by credential (service account or OAuth user). If one credential dominates, focus on per-user windows.
- Inspect Cloud Console logs and the API response body for error.reason or message.
- Apply retries with increasing delays and add client-side throttling for bursty jobs.
For a root-cause playbook and example Cloud Monitoring dashboards, see our Google Sheets API 429s and Quotas (2026): Root‑Cause Playbook + Cloud Monitoring Dashboards and Alerting. Sheet Gurus API reduces quota risk by offering configurable per-key rate limits and optional Redis caching to cut Google Sheets API calls in high-throughput flows.
How to check current quota usage in Cloud Console 📊
You can view usage and remaining quotas per metric in Cloud Console under APIs & Services > Quotas. The console shows quota consumption over time and lets you filter by API, metric, and region, which helps link a spike to a specific operation or timeframe.
Step-by-step checklist to export graphs and set alerts:
- Open Google Cloud Console and go to APIs & Services > Quotas.
- Filter the list to the Google Sheets API and select the metric you want to inspect, such as "Requests per minute" or "Requests per 100 seconds per user."
- Click the metric and then View metrics to open the chart in Cloud Monitoring. From there export CSV or JSON for historical analysis.
- Create an alerting policy in Cloud Monitoring using the same metric. Set thresholds at conservative levels (for example, 70% of your quota) and configure email or Slack notifications.
- If you rely on a single service account for syncs, add an alert specifically for per-user windows tied to that credential.
💡 Tip: Set alerts early. A notification at 60% usage during nightly runs prevents morning outages and gives time to throttle jobs.
If you prefer to avoid building quota monitoring yourself, Sheet Gurus API provides per-key usage tracking and configurable rate limits so you can protect the Google Sheets API quota by controlling traffic before it reaches Google. For implementation examples and which calls to prune first, read our Google Sheets API Quotas and 429s: How to Increase Limits and Prevent Errors (2026 Guide + Calculator).
What proven strategies reduce Google Sheets API quota usage?
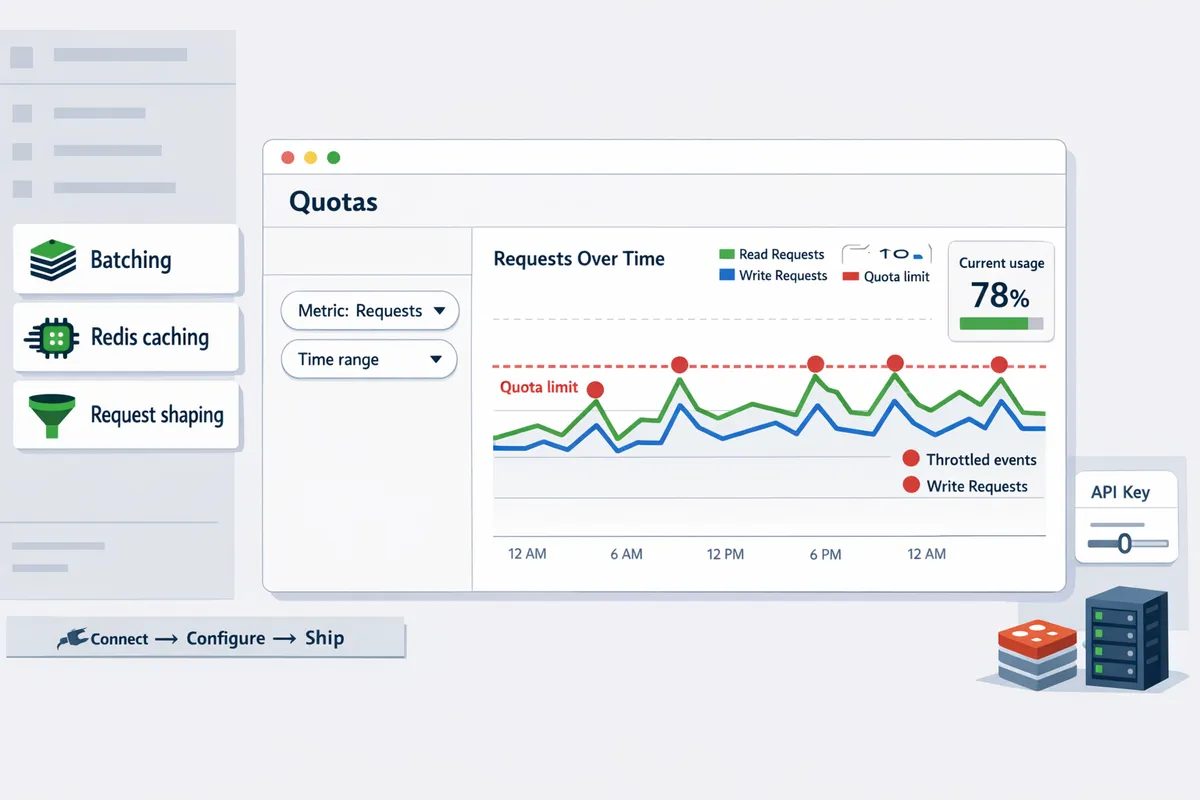
Batching, caching, and request shaping reduce google sheets api quota usage by lowering call counts and smoothing traffic. These tactics cut the number of Google Sheets API reads and writes your app performs and make quota consumption predictable under real workloads. Sheet Gurus API provides built-in features for batching, optional Redis caching, and configurable rate limiting to apply these strategies without building a custom backend.
Batching and efficient operations 🧩
BatchGet is an API operation that consolidates multiple range reads into a single request, and BatchUpdate is an API operation that combines multiple write operations into one call. Use BatchGet for read-heavy endpoints that request multiple noncontiguous ranges in the same user flow. Use BatchUpdate when a user action changes several cells or rows at once (for example, bulk status updates or CSV imports).
Rules of thumb for batching versus incremental reads.
- Batch when a user action touches many rows at once. Example: a nightly sync that reads 500 rows should use 1–3 batch calls instead of 500 individual reads. This reduces per-call overhead and the google sheets api quota you consume.
- Read incrementally when changes are small and frequent. Example: an edit widget that updates a single cell should use an incremental update to avoid delaying low-latency interactions.
- Group contiguous ranges together. Contiguous ranges compress better into a single BatchGet call and are simpler to reconcile on write.
Practical example. A small ops team that once sent 200 separate read requests for a report can usually cut that to 2 BatchGet calls by grouping ranges per worksheet. Our Sheet Gurus API maps common CRUD flows to minimal API calls so you get batching without extra glue code. For more on quotas and which calls to prune first, see our Google Sheets API Pricing and Quotas Guide.
Caching with Redis and TTL (use Sheet Gurus API) 🔁
Caching is a temporary data store that serves repeated queries without contacting the original sheet, and using Redis for that cache reduces repeated Google Sheets API reads. Use cache for read-heavy endpoints such as dashboards, autocomplete lists, and dropdown options.
How to choose TTLs and invalidate safely.
- Short-lived data (live dashboards): use TTLs of 15–60 seconds and combine with a write-through invalidation on updates.
- Reference data (product lists, country codes): use TTLs of 30 minutes to several hours depending on update frequency.
- On-write invalidation: clear or refresh the relevant cache keys when an API write occurs or when your webhook receives a sheet-change notification.
Practical setup with Sheet Gurus API. Our API offers optional Redis caching that can serve frequent queries without hitting Google Sheets each time. For a dashboard that polls every 10 seconds, switching to a 30-second TTL or using write-triggered invalidation typically cuts read volume by 70–90% and prevents quota spikes. Read more about handling quota spikes and 429 errors in our 429s and Quotas guide.
💡 Tip: Use descriptive cache keys that include sheet ID and query parameters so invalidation targets only the affected cached responses.
Configurable rate limiting and request shaping ⏱️
Rate limiting is a control that constrains requests per API key or project to smooth traffic and prevent sudden bursts from exhausting google sheets api quota. Apply limits both per-client (API key) and globally to protect shared backend quota.
How to shape requests practically.
- Set per-key caps below the Google per-user quota to prevent one client from consuming shared capacity. Example: if a project sees 100 concurrent clients, cap each key to a small steady throughput and allow a modest burst size.
- Queue excess requests and return a 429-friendly response with a retry-after header so client apps can back off gracefully.
- Use jittered retries on the client side to avoid synchronized retry storms.
Sheet Gurus API supports per-key and global rate limits so you can enforce consistent throughput without adding operational complexity. If you need a step-by-step fault playbook, our root-cause playbook and monitoring guide shows how to set alert thresholds and dashboard metrics for quota exhaustion.
Design patterns for low-quota environments 🧭
Change-only syncs, webhooks, and pagination minimize full-sheet scans and are the safest design patterns when quota is tight. Choose the pattern that matches your use case to avoid wasting calls.
Scenario-based recommendations.
- Internal dashboard polling (low latency, many viewers): enable Redis caching with short TTLs, subscribe to sheet webhooks for writes, and use BatchGet for aggregated reads. This prevents each viewer from triggering separate sheet reads.
- High-frequency automation (background jobs updating rows every minute): switch to change-only syncs that query only modified ranges and group writes with BatchUpdate. Avoid scanning the entire sheet on each run.
- AI or query workloads (ad hoc filtering and searches): use MCP-style queries or filtered endpoints that return paginated results instead of full-sheet exports.
Step-by-step for a small team moving a prototype to production.
- Profile current calls to identify full-sheet reads and hot endpoints.
- Add short-term Redis caching for the top 3 read endpoints.
- Replace polling with webhooks where possible.
- Apply per-key rate limits that reflect expected client concurrency.
Sheet Gurus API exposes MCP queries and webhook hooks so teams can adopt these patterns without building a custom sync service. For estimator tools and a ticketed playbook to request quota increases, consult our Quotas and 429s guide and the Pricing and Quotas Guide.
How do you plan, request, and measure quota increases for production workloads?
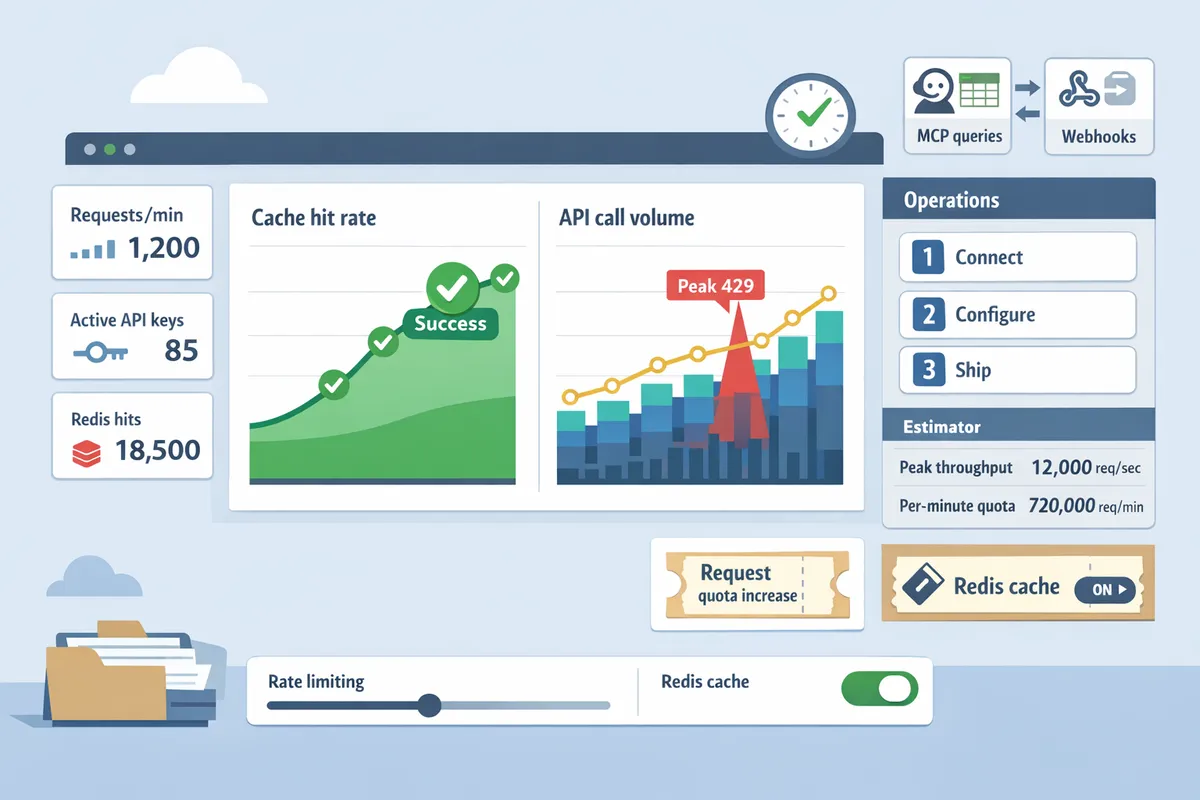
Plan, request, and measure quota increases by converting your peak throughput goals into concrete per-minute and per-user quota numbers, then submitting a Cloud Console request with traffic graphs and a test plan. Prepare logs and monitoring dashboards before filing a request so Google sees stable, repeatable traffic rather than a one-off spike. Use the estimate worksheet below, follow the 2026 Cloud Console workflow, and measure impact after any change to avoid repeat requests.
Quota estimator 📊
Estimate required Google Sheets API quotas by calculating operations per session, sessions per minute, and peak concurrent users to produce per-minute and per-user quota targets. Use a simple worksheet that separates reads from writes, because Google counts them differently and limits vary by metric.
Recommended worksheet layout (columns):
| Input | Example | Notes |
|---|---|---|
| Operations per session (reads) | 4 | Average read calls a single user triggers per action |
| Operations per session (writes) | 2 | Average write calls per action |
| Sessions per minute (peak) | 50 | Concurrent completed sessions started in one minute |
| Concurrent users | 25 | Users actively performing actions at the same time |
| Safety multiplier | 1.5 | Headroom for unexpected bursts |
| Required reads/minute (output) | 4 * 50 * 1.5 = 300 | Round up to nearest 10 |
| Required writes/minute (output) | 2 * 50 * 1.5 = 150 | Match Google metric names when requesting |
Step-by-step estimator use:
- Measure a representative session in staging and count API calls for each operation.
- Multiply by expected peak sessions per minute.
- Apply a safety multiplier (1.25–2x depending on burstiness).
- Map outputs to Google quota names (reads per minute, writes per minute, per-user limits).
For a ready checklist and an alternate calculator, see our quota calculator guide and the pricing and quotas guide to validate which metrics Google enforces: Google Sheets API Quotas and 429s: How to Increase Limits and Prevent Errors (2026 Guide + Calculator) and Google Sheets API Pricing and Quotas Guide.
How to request quota increases in 2026 📨
To request a quota increase in 2026, open the Google Cloud Console quota page for the Sheets API and submit a quota request that includes traffic graphs, a test plan, and a business justification with projected peak load. Google now expects evidence showing sustained patterns rather than ad-hoc spikes.
Follow this step-by-step request workflow:
- Identify exact quota metric names (example: "Read requests per minute per user").
- Prepare artifacts: 7–30 days of Cloud Monitoring graphs, raw request timestamps (CSV or logs), and a short PDF test plan that explains how you will validate the increase.
- Fill Cloud Console fields: Project ID, Billing account, Quota metric, Current quota, Requested quota, Requested justification (200–400 words), Contact email and phone, and Attachments (graphs + CSV).
- Submit and track the request in the Cloud Console.
💡 Tip: Upload a short, time-stamped CSV of representative request logs and a link to a live dashboard. That reduces back-and-forth questions and usually shortens review time.
For examples of what to include in traffic graphs and long-term monitoring, see our dashboard playbook: Google Sheets API 429s and Quotas (2026): Root‑Cause Playbook + Cloud Monitoring Dashboards and Alerting.
What Google typically asks for and expected timelines ⏱️
Google typically asks for recent logs, projected sustained traffic, and abuse-mitigation steps before approving quota increases. Response time commonly ranges from a few business days for straightforward increases to several weeks for high-volume requests or where additional security review is needed.
Common requests from Google reviewers:
- Last 7–30 days of traffic graphs and raw timestamps.
- A description of peak versus average traffic and the business process driving the peaks.
- Mitigation controls: rate limiting, throttling policies, and abuse detection.
- Proof that billing is enabled and that the project owner can be contacted.
How to shorten review time:
- Pre-submit a short load test report that shows steady-state traffic at your requested level.
- Provide a mitigation checklist (automatic retries with exponential backoff, user-level rate limits, and alerting).
- Flag the request as urgent only when you can supply real-time dashboards and a named contact who can answer reviewer questions.
⚠️ Warning: Submitting vague justifications or single-day spikes often triggers follow-up requests and delays the decision.
How Sheet Gurus API reduces the need for quota increases ✅
Sheet Gurus API reduces direct Google Sheets API calls by exposing a RESTful JSON API with configurable per-key rate limits and optional Redis caching that cuts peak call volume. That often lets teams avoid or defer asking Google for higher quotas while preserving user experience.
How Sheet Gurus helps in practice:
- Configure per-key or global rate limits to smooth peaks before they hit Google quotas.
- Enable Redis caching for frequently read rows so repeated UI queries do not count as new Google Sheets reads.
- Use per-sheet permissions and API key controls to isolate problematic clients without raising global quotas.
Operations checklist to measure reduced call volume after adopting Sheet Gurus API:
- Capture a baseline: 24–72 hours of Google Sheets API calls/minute and number of 429s.
- Deploy Sheet Gurus with caching enabled on a staging key.
- Run a 24–72 hour A/B test comparing the same traffic pattern through the direct integration and the Sheet Gurus endpoint.
- Measure key deltas: peak requests/minute to Google, average latency to users, and 429 count.
- If peak Google calls drop below your estimated thresholds, cancel or downscale the quota request.
For implementation details and API examples, see the Sheet Gurus API reference and our product overview: API Reference and About Sheet Gurus API. For a side‑by‑side look at wrappers versus the official API, consult our comparison benchmarks: Official API vs Apps Script vs Third‑Party REST Wrappers.
Frequently Asked Questions
This FAQ answers common operational questions about google sheets api quota and how Sheet Gurus API reduces quota risk. Use these short answers to decide when to request increases, what metrics to monitor, and which mitigations to apply. Follow the linked playbooks for step-by-step procedures and calculators.
How do per-user quotas differ from per-project quotas? 🤝
Per-user quota is a limit that caps requests from a single authenticated account over short windows, while per-project quota caps total usage across all accounts tied to a project. Per-user windows (for example, the 100-second user window) exist to stop one heavy client from blocking other users; project quotas exist to control overall capacity and billing exposure. For example, a cron job that authenticates as a single user can hit the per-user window quickly even if project-level usage stays low. To manage both, separate automation into distinct service accounts or use Sheet Gurus API's per-key rate limiting to smooth individual clients and protect shared quotas. For more on differences and planning, see our comparison of official API limits and third-party wrappers.
What triggers a 429 quota exceeded error? ⚠️
A 429 error happens when requests exceed the allowed rate for the specific metric and scope, such as reads per minute or the per-user 100-second window. Common triggers include big bursty syncs (many reads/writes in seconds), cascading client retries that multiply load, and background jobs that authenticate as the same account. Inspect request timestamps, client IDs, and error footprints to identify which window you hit. Use rate limiting and optional Redis caching in Sheet Gurus API to reduce bursts. ⚠️ Warning: aggressive retry logic without exponential backoff often makes 429s worse by increasing instantaneous traffic. Our root-cause playbook shows how to map 429s to quota windows and build Cloud Monitoring dashboards.
Can Sheet Gurus API help me avoid requesting quota increases? ✅
Yes. Sheet Gurus API reduces direct Google Sheets API calls with optional Redis caching, per-key rate limiting, and aggregated endpoints that lower peak usage. In practice, caching cuts repeated reads, aggregated endpoints let you replace many row-level reads with one JSON fetch, and per-key throttles smooth traffic so short spikes do not hit quota windows. For example, a nightly sync that previously issued 200 row reads can often be refactored to a single aggregated request through Sheet Gurus API. These controls commonly remove the immediate need to submit an increase and let teams buy time while they prepare formal quota requests. See our guide on pricing and quotas for which calls to prune first.
💡 Tip: Enable per-key throttling in Sheet Gurus API during ramp-up and set alerts at 80% of any quota window to catch rising usage early.
How long does Google typically take to approve a quota increase? ⏳
Approval commonly takes from a few business days to several weeks depending on request completeness and required reviews. Requests with clear traffic samples, exact per-minute numbers, a rollback plan, and mitigation steps (batching, caching, throttling) get faster reviews. When preparing a request, include recent Cloud Console graphs, describe client types, propose the narrowest possible increase, and show how Sheet Gurus API or other mitigations will limit risk if traffic spikes. For a step-by-step request template and realistic timelines, consult our quota increase playbook and calculator.
Are there daily limits or only per-minute windows? 📆
Google enforces short windows (per-minute, per-100-seconds) plus project-level thresholds rather than a single simple daily cap for all operations. This means a steady hour of traffic can behave differently than a short burst of the same total volume; a 500-request nightly burst can blow short windows even if daily totals stay modest. Plan for both steady-state hourly throughput and short peaks by smoothing traffic, batching operations, and using Sheet Gurus API caching to convert many rapid reads into fewer calls. Our pricing and quotas guide explains how to translate throughput goals into specific window targets.
Which metrics should I monitor to prevent quota exhaustion? 📈
Monitor requests per minute, per-user 100-second rates, error percentages for 4xx/5xx, and request latency. Set alerts on any quota window approaching 80% and on sustained increases in 4xx errors; rising latency often precedes quota saturation. Build dashboards that show client-level request distributions so you can spot a single consumer driving most traffic. Use Cloud Monitoring for official quota metrics and pair that with Sheet Gurus API usage data and per-key logs to trace which API keys or spreadsheets generate peaks. Our 429s playbook includes dashboard templates and alert thresholds you can import.
For detailed procedures, calculators, and dashboards: see our Google Sheets API Pricing and Quotas Guide, the Increase Limits and Prevent Errors guide + calculator, and the 429s root-cause playbook with Cloud Monitoring templates.
Move quota planning into production-ready APIs with fewer calls and built-in controls.
Estimate and control your google sheets api quota before you hit 429 errors: forecast peak usage, prune nonessential calls, and add caching or throttling where it matters. Our Pricing and Quotas Guide shows how to map per-minute and per-day limits to real workloads and plan capacity.
Sheet Gurus API turns Google Sheets into production-ready RESTful JSON APIs in minutes, requiring no backend code. Use the platform to remove custom backend risk and get a predictable surface that reduces quota surprises for production workloads.
If you need higher limits, follow the procedural playbook for how to increase google sheets api quota 2026 in our 429s and quotas guide to request quota increases and set up monitoring and alerts. Start with the highest-impact change first: cut noisy reads or enable caching.
Start a 14-day free trial at Sheet Gurus API to connect a sheet, generate a live endpoint, and test quota controls against your real traffic. For implementation patterns and alert templates, see Sheets Auth & Quotas and the 429s troubleshooting playbook.