
Google Sheets API 429s and Quotas (2026): Root‑Cause Playbook + Cloud Monitoring Dashboards and Alerting
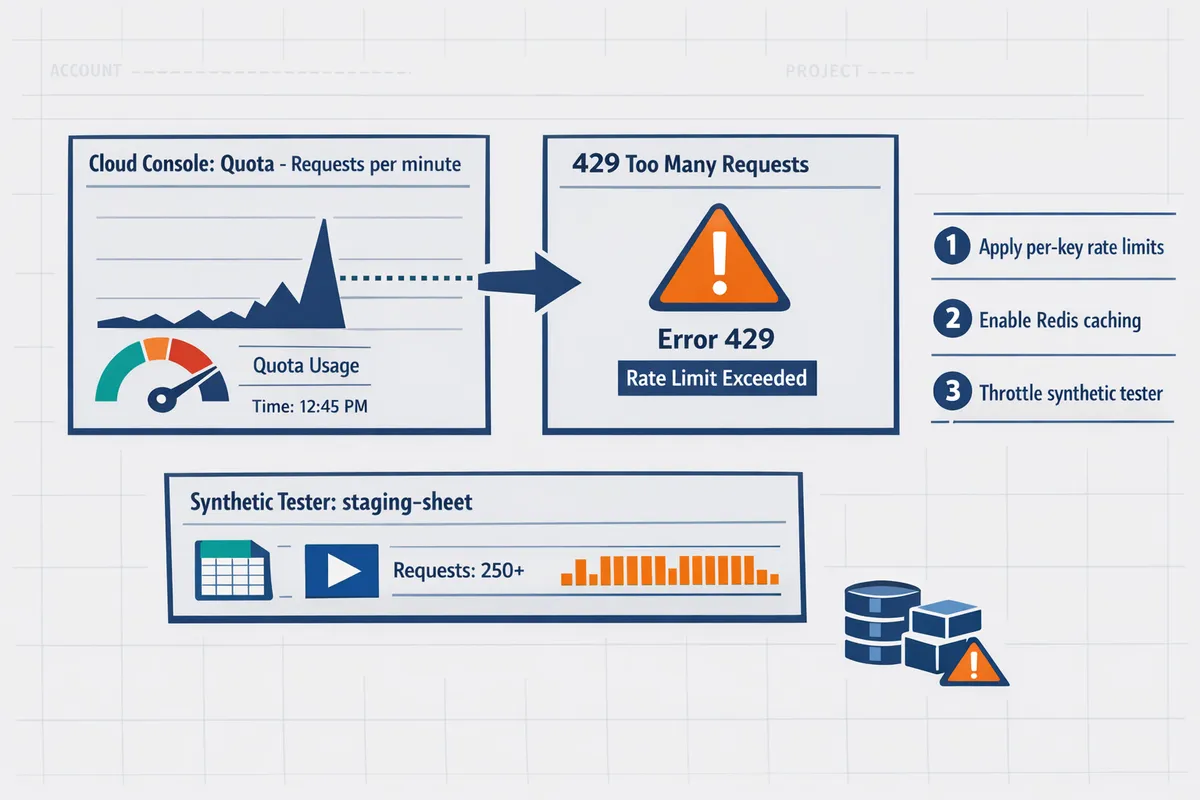
A burst of 500 requests in one minute can trigger 429 errors and halt critical automation. Google sheets api quotas are rate and resource limits that return 429 "Too Many Requests" when exceeded. This how-to guide helps developers and ops teams diagnose 429s, build Cloud Monitoring dashboards and alerts, and apply operational controls to prevent quota outages. Sheet Gurus API turns sheets into production-ready RESTful JSON APIs in minutes, providing API key auth, configurable rate limits, and optional Redis caching so teams cut direct Sheets calls without a custom backend. Import dashboard templates and learn the one metric teams often miss when diagnosing quota problems.
How do I diagnose Google Sheets API 429 errors and map quota types to my workload?
You diagnose 429 errors by matching the quota metric in the API error to the Cloud Console quota entry, then verifying with Audit Logs and a controlled replay of your workload. This produces a clear proof path: error payload -> quota metric -> request traces -> reproduced rate. Use that proof to pick the correct mitigation: rate limit, cache, batch, or request a quota increase.
Step 1 — Identify the quota type and enforcement window 🧭
Check the 429 response and Cloud Console Quotas page to determine whether the error is per-project, per-user, or Sheets-specific. Inspect the API error payload for the metric name or error code, then open Cloud Console > IAM & Admin > Quotas (filter by Google Sheets API) and match the metric name to the listed enforcement window (per minute, per 100 seconds, per day). Note the quota path exactly as shown in the console.
Record whether the hit is global (project-wide) or scoped to a single OAuth client, API key, or service account. Sheet Gurus API surfaces per-key request counters and rate-limit headers in the dashboard, which helps map an observed 429 to a specific client without digging through every Sheets call in Google Cloud.
Step 2 — Pull request traces and Cloud Audit Logs 🔍
Use Cloud Audit Logs and your application traces to find bursts, duplicate calls, and retry loops that coincide with 429 timestamps. Filter logs by OAuth client ID, service account, or the API key shown in the error. Look for clustered timestamps, identical payloads, or a retry pattern where the same request repeats within seconds; these patterns point to polling loops, misguided retries, or unbatched background jobs.
Also check your app logs for missing idempotency keys, queued tasks that trigger many writes, or client libraries that retry aggressively. Sheet Gurus API provides per-key logs and request-level metadata you can use to identify the offending integration and throttle or patch it immediately.
⚠️ Warning: Run forensic queries against log exports or a staging copy. Do not replay high-volume tests directly against production spreadsheets without a verified backup.
Step 3 — Run a controlled reproduction and use a workload calculator 🧪
Reproduce the 429 with a small synthetic tester that matches your app's mix of reads and writes and measure calls per minute against the quota window. Build a basic workload calculator: map user actions to API operations (example: "submit form" = 1 read for validation + 1 append row + 1 update formula = 3 API calls). Multiply by concurrent users and expected actions per minute to estimate peak calls per minute.
Example scenario: 30 active users doing 2 "submit" actions per minute at 3 calls each yields 180 calls per minute. If your observed error ties to a per-user minute window, test whether a single user's pattern reproduces the 429. Sheet Gurus API lets you enable Redis caching and per-key rate limits to run the same tests while reducing upstream Google Sheets API calls.
Expected outcome: a reproducible test that either triggers the same 429 or shows that another system (background worker, third-party integration) produced the burst.
Step 4 — Map quota metrics to business impact (comparison table) 📊
Compare per-project, per-user, and Sheets-specific quotas so you can prioritize fixes by scope and revenue impact.
| Quota metric | Typical enforcement window | Common symptom | Business impact | Fast mitigation |
|---|---|---|---|---|
| Per-project requests | Per minute / per 100s | Whole-app 429s across many users | High. Outages for dashboards, automations | Global rate limiting, cache, request quota increase |
| Per-user requests | Per minute per user | Single user or session gets 429s | Medium. Affects specific customers or bots | Client-side backoff, per-key limits, slower retries |
| Read/write operation limits | Per-minute or per-day by operation type | Specific operations fail (reads vs writes) | Varies. Write-heavy pipelines can halt ingestion | Batch writes, reduce polling, enable caching |
| Cell/row limits | Daily or per-request caps | Errors on large imports or large-range reads | High for bulk imports and migrations | Chunk imports, use Sheet Gurus API endpoints for pagination |
Use this table with evidence from logs to choose whether to apply per-key throttles, cache-heavy fixes, or a formal quota increase request. Sheet Gurus API maps sheet operations to JSON endpoints and exposes pagination, which reduces large-range reads that hit cell or row limits.
Step 5 — Document findings and trigger the right next steps 🗂️
Record the exact quota metric name, the log excerpts that show the burst, the synthetic test plan and result, and an owner responsible for remediation. Attach Cloud Console screenshots or a CSV export of matching audit log entries to your incident ticket so reviewers see the timeline and scope.
If you decide to request a quota increase, gather prerequisites: billing enabled, active project, API usage graphs showing sustained need, and a clear business justification with expected peak and steady-state volumes. Requests are reviewed case by case and may take days for standard cases or longer for complex increases. For step-by-step instructions, templates, and a usage calculator, see our guide on increasing quotas and preventing 429s. Link your runbook to Sheet Gurus API documentation and to the API reference so implementers can apply per-key rate limiting, enable Redis caching, or switch to paginated endpoints quickly.
Related reading: review our detailed quota increase playbook in Google Sheets API Quotas and 429s: How to Increase Limits and Prevent Errors (2026 Guide + Calculator) and the quick reference in Google Sheets API Documentation: Quickstart, Quotas, Examples, and a Faster JSON API Alternative.
How do I set up Cloud Monitoring dashboards and alerts for Google Sheets API quotas?
Set up Cloud Monitoring dashboards and alerts so you get early warnings before Google Sheets API 429s affect users. The workflow below shows how to enable metrics, build focused dashboards, create multi-condition alerts for per-minute and per-user signals, and validate the whole path with a controlled test. Each step includes expected outcomes and what can go wrong.
Step 1: Enable Cloud Monitoring metrics and link the project to a billing account.
Enable Cloud Monitoring and confirm the Sheets API is publishing metrics you can query in Metrics Explorer. In Cloud Console, create or attach a Monitoring Workspace to your project, enable the Monitoring API, and confirm the Google Sheets API is enabled for the same project. Query metrics like request_count, request_errors, and quota_usage in Metrics Explorer to prove data flows; if you see no data check IAM permissions and that billing is active. If you use Sheet Gurus API, verify its operational metrics (rate limit events, cache hit rate) appear alongside Google metrics so you can correlate upstream quota pressure with downstream throttles.
Expected outcome: Metrics Explorer shows time series for request_count and request_errors within 5–10 minutes. Common failure: missing billing or wrong project workspace prevents metric ingestion.
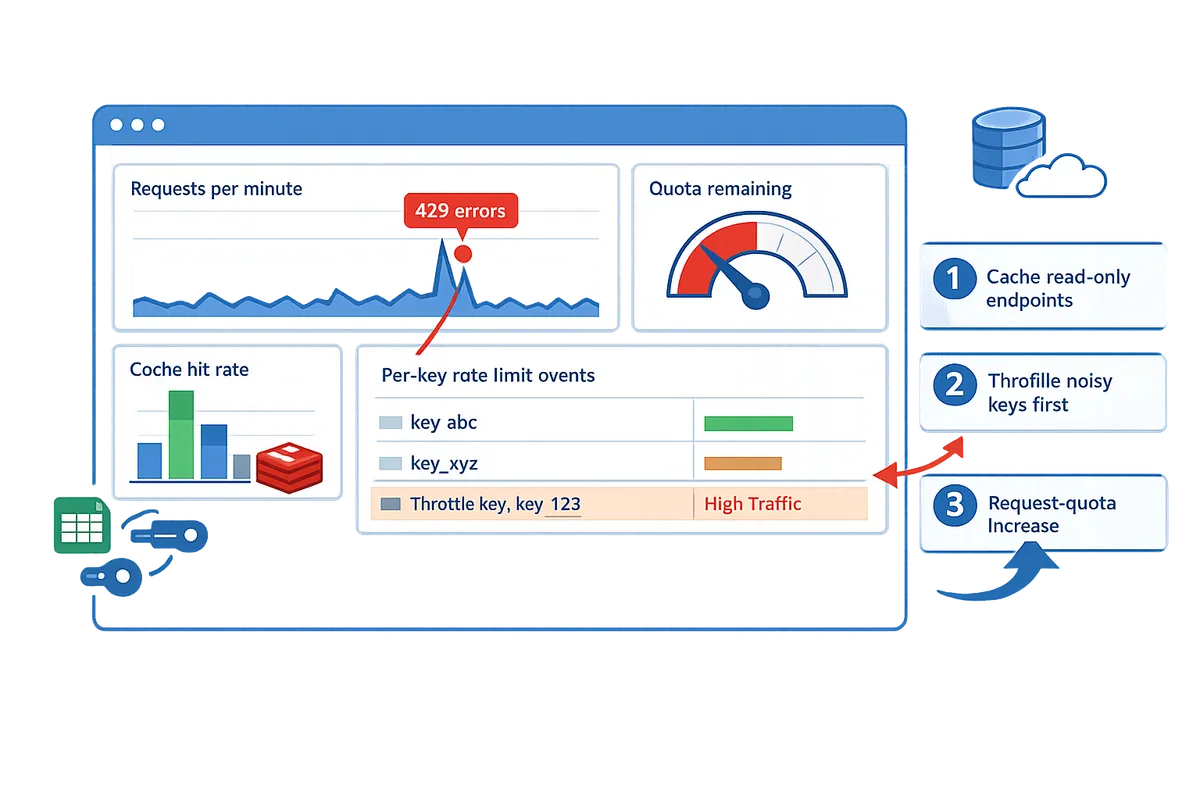
Step 2: Build a dashboard that tracks request rate, error rate, and quota usage. 🔎
A dashboard should surface requests per minute, 429 error counts, and remaining quota with filters for API key, OAuth client ID, and sheet ID. Create three widgets: a time-series for requests per minute (aggregate by minute), a stacked time-series for response codes with an explicit 429 line, and a gauge or time-series for quota_remaining or quota_usage. Add resource-level filters: API key, OAuth client ID, and sheet ID so you can isolate a noisy consumer. If you use Sheet Gurus API, add panels for cache hit rate and per-key enforced rate limit so you can see how caching and provider throttles reduce Google call volume.
Example metric filter: request_count filtered by response_code=429. Expected outcome: you can click an API key filter and see its RPM and 429 spike within the last hour.
Step 3: Create alerting policies for early-warning thresholds and incident thresholds. ⚠️
Create multi-condition alerting policies that separate early warnings from emergency incidents using sustained and immediate conditions. Implement at least two conditions per policy: a sustained spike condition (for example, RPM above your baseline for 5–10 minutes) and an immediate error surge condition (sudden 429s over a short window). Configure separate policies for per-user or per-key signals and per-project signals so one noisy client does not flood on-call. Use notification rate limits and suppression windows to prevent alert storms.
Example thresholds: set an early-warning when requests per minute exceed baseline by 2x for 10 minutes, and an incident when 429 error rate exceeds X% of requests in 1 minute. Expected outcome: early-warning fires before user-facing failures so you can apply mitigations; incident policy should reliably notify when 429s rise sharply.
Step 4: Configure notification channels and runbook links for each alert. 🔔
Connect notification channels and attach a short runbook so alerts immediately reach the right responder with next steps. Add PagerDuty, Slack, or email channels and link a runbook that lists immediate mitigation actions: apply traffic shaping, enable caching or route traffic to a backup API, and throttle or revoke specific API keys. Make the runbook no longer than five actions and include the dashboard link and the query used to identify offending API keys. If you use Sheet Gurus API, add quick-run steps that show how to adjust per-key rate limits and toggle Redis caching from the Sheet Gurus dashboard.
💡 Tip: Put a direct link to the dashboard panel that filters by API key inside the runbook so responders can jump to the offending consumer with one click.
Expected outcome: alerts route to on-call and the runbook shortens time-to-mitigation.
Step 5: Test alerts and simulate throttling to validate escalation paths.
Validate alerts by running a controlled spike in a staging project and confirming each alert condition, notification channel, and runbook step behaves as expected. Create a small test harness that issues controlled read/write bursts at known rates and track the timeline: spike start, metric ingestion, alert evaluation, and notification delivery. Record the time delta between spike and alert; adjust thresholds if alerts arrive too late or too noisy. If you use Sheet Gurus API, test how its per-key rate limits and cache settings affect both the incident and the Google Sheets API metric streams.
Expected outcome: every alert triggers within the expected SLA window and notifications reach all channels. Common failure: missing escalation or misconfigured suppression blocks paging.
Step 6: Use Sheet Gurus API features to reduce Google call volume and surface provider metrics.
Use Sheet Gurus API to cut raw Google Sheets API calls by enforcing per-key rate limiting and enabling optional Redis caching, and surface those provider metrics in your dashboard. Configure per-key limits to stop a single client from exhausting project quotas, enable Redis caching for read-heavy endpoints, and add dashboard panels for cache hit rate and Sheet Gurus enforced rate limit events to measure impact. Correlate cache hit rate increases with drops in Google request_count to prove the intervention works; if hits increase and Google calls drop, you reduced quota pressure without coding a custom backend.
Expected outcome: you see measurable drops in Google request_count after enabling caching or lowering per-key limits. If you need guidance on which endpoints to cache or which keys to throttle first, review our guide on quota increases and pruning noisy calls in "Google Sheets API Quotas and 429s: How to Increase Limits and Prevent Errors (2026 Guide + Calculator)".
Related resources: see our implementation notes in "Google Sheets API Documentation: Quickstart, Quotas, Examples, and a Faster JSON API Alternative" for metric names and the operational checklist in "No-Code Google Sheets REST API: From Prototype to Production (Auth, Rate Limits, Caching, AI Agents)" for production controls.
How do I mitigate quota problems with operational practices, optimizations, and alternatives?
Apply batching, caching, deduplication, per-key rate controls, smart scheduling, and an explicit migration plan to reduce google sheets api quotas risk and avoid recurring 429s. These operational controls cut call volume, smooth request spikes, and keep downstream systems stable while you assess whether a dedicated backend or a managed API fits your needs.
Batch reads and writes and avoid per-row write storms. 🧩
Batching groups multiple row operations into single API calls to reduce request counts and lower per-minute consumption. For example, combine 50 row updates into one batch write so you perform 1 call instead of 50. Buffer writes for short windows (5–30 seconds) and flush in chunks; for high-volume syncs test chunk sizes between 50–500 rows to balance latency and partial-failure risk. Our API reference documents how to map CRUD actions to batched endpoints and how Sheet Gurus API maps sheet operations to single HTTP requests so you avoid hundreds of small writes.
Use caching for reads and short-lived generated views (Redis recommended). 🗄️
Caching returns recent results without calling Google Sheets for each request and reduces read pressure during high-concurrency periods. Use Redis or an equivalent cache with configurable TTLs: sub-10-second TTLs for near-real-time dashboards, multi-minute TTLs for reporting pages. Invalidation must be write-driven: purge or update cache on successful writes, or use webhooks to push cache updates after sheet edits. Sheet Gurus API offers optional Redis caching so your app serves stable JSON responses while cutting upstream Sheets API calls.
💡 Tip: Configure cache-aside for read-heavy endpoints and ensure writes trigger immediate invalidation to avoid stale dashboards.
Apply per-key rate limiting, deduplication, and scheduled retries. ⏱️
Per-key throttles and gateway-level deduplication prevent a single client from exhausting project-level quotas and causing 429s for everyone else. Enforce small per-key burst windows and queue excess writes, drop identical requests at the gateway, and schedule non‑critical syncs during off-peak windows to flatten RPM. Implement idempotency for write requests so retries do not create duplicates. Sheet Gurus API includes configurable per-key limits and global safeguards, letting you enforce these controls without building a bespoke rate-limiter.
Use the workload planner with scenario examples to predict quota needs. 📊
A workload planner converts user actions into reads/writes per minute so you can see when google sheets api quotas will be exhausted and which mitigations matter most. Below are three common scenarios with projected requests per minute and recommended mitigations.
| Use case | Assumptions | Projected RPM | Primary mitigation |
|---|---|---|---|
| Internal dashboard | 50 users, each polls a view every 10s (1 read each) | 300 reads/min | Add caching with 10s TTL and server-side aggregation (reduces reads by ~90%) |
| Automated pipeline | 1 job runs every 5m, updates 500 rows in batches of 50 | 100 writes/min (10 batch writes per run) | Batch writes + schedule off-peak windows to spread writes across minutes |
| AI assistant / agent access | 20 agents, each issues 2 queries/min with occasional writes | 40 reads + 5 writes/min | Per-key rate limits, query caching, and write queuing to prevent bursts |
Use these scenarios to size expected RPM and then simulate traffic in a staging project to confirm. For calculators and a quota increase playbook, see our Google Sheets API Quotas and 429s guide and calculator.
Evaluate alternatives and migration triggers for production scale. ⛳
Move off Sheets when you see persistent quota throttling, sheet size approaching documented row/column limits, or SLA needs that Sheets cannot meet without significant engineering. Business signals that indicate migration: repeated incidents that cost engineering time, tight SLA penalties tied to data freshness, or audit/compliance demands that Sheets cannot satisfy.
Compare trade-offs to decide the path:
- Move to a database: higher upfront engineering and migration cost, better horizontal scale, transactional consistency, and lower long-term quota risk. Best when you need high write concurrency or complex queries.
- Use Sheet Gurus API: minimal engineering, immediate operational controls (API keys, per-key rate limiting, optional Redis caching), and faster time to production while keeping the spreadsheet as the source of truth. This option reduces build-and-maintain overhead and preserves the familiar spreadsheet UX for non-technical editors.
See our piece on No-Code Google Sheets REST API: From Prototype to Production for a side-by-side look at operational controls you get without creating a custom backend.
Common mistakes and troubleshooting checklist. 🛠️
Unbounded polling, missing caches, and loose alert thresholds commonly cause quota incidents; follow this checklist to recover and prevent recurrence.
- Reproduce the incident in staging to confirm the request pattern. Expected outcome: you see the same RPM and error type.
- Isolate offending client(s) and apply temporary per-key throttles at the gateway. Expected outcome: system-wide 429s stop immediately.
- Apply short-term mitigations: enable caching, increase batch sizes, or pause non-critical pipelines. Expected outcome: quota consumption drops within one quota window.
- Update dashboards, runbooks, and alert thresholds to detect the same pattern next time. Expected outcome: future spikes trigger early alerts instead of service impact.
⚠️ Warning: Do not rely on manual token refresh or ad-hoc backoff for production traffic; those approaches delay recovery and increase incident time.
Frequently Asked Questions
This FAQ answers the most common operational questions about google sheets api quotas, Cloud Monitoring alerts, and when to use Sheet Gurus API. The answers focus on actionable steps you can apply immediately to diagnose 429s, tune dashboards, and reduce outage risk.
What exactly counts against Google Sheets API quotas? 📊
Reads, writes, batch updates, and other requests that fetch or change spreadsheet data count against google sheets api quotas. Google exposes method-level metrics (for example, spreadsheets.values.get, spreadsheets.values.batchUpdate, and spreadsheets.batchUpdate) and enforces per-minute project limits as well as per-user limits. For example, a single client that issues many small writes (one-cell updates) will consume more write operations than a client that bundles those edits into a single batchUpdate. Map the API error metric name in the 429 response to the Cloud Console quota entry and use Audit Logs to confirm which method triggered the spike. Sheet Gurus API reduces direct Google calls by supporting batched operations and optional Redis caching so your app issues fewer raw Sheets API requests.
How do I request a quota increase for a Sheets API metric? 📨
Open the Cloud Console quota page, select the exact Sheets API metric, enable billing on the project, and submit a quota increase request with a clear traffic profile and mitigation plan. 1) Identify the exact quota metric from the 429 error and Cloud Console. 2) On the quota page choose "Edit quotas," attach your billing account, and paste a justification that includes peak RPS, expected daily requests, and what you will do while waiting (backoff, throttling, caching). 3) Include screenshots of Cloud Monitoring graphs and an expected timeline for growth so reviewers can validate the request quickly. Expect multi-day to multi-week processing for non-trivial increases; smaller changes often complete faster if you show a tested mitigation strategy.
💡 Tip: Provide a short controlled-replay plan (time window, test client IDs, expected request rate) in your justification; reviewers approve increases faster when they can validate safe growth.
Refer to our quota increase playbook and calculator for staged examples and sample justification language: quota increase playbook and calculator.
How can I monitor per-user vs per-project quota usage separately? 🧭
Create two Cloud Monitoring panels: one filtered by user identifier (OAuth client ID, service account, or user email) and one showing project-wide request counts and error rates. Use label filters in metrics explorer to isolate oauth_client_id or principalEmail for per-user panels, and use project-level metrics for the global panel so you can view both side-by-side. Add Audit Logs panels showing the invoking client and method name to trace spikes to a single integration or to aggregated background jobs. Sheet Gurus API also emits per-key metrics and usage logs you can correlate with Google metrics, which helps identify whether a single API key or a project-level bot is responsible for most traffic. For dashboard patterns and example queries, see our Cloud Monitoring dashboard guide in the quotas documentation.
When should I move data off Google Sheets because of row, column, or cell limits? 🚚
Plan migration when you routinely hit structural limits or when quota throttling causes repeated SLA failures for critical workflows. Use Google's published row/column/cell limits as a planning reference and treat any workflow that requires frequent full-sheet rewrites or high write frequency (for example, thousands of small writes per minute) as a migration candidate. Example: a dashboard that polls and writes 5,000 cells per minute will face both performance and quota constraints; moving append-heavy or indexed datasets to a database reduces write frequency and enables efficient queries. If you can reduce writes by batching, caching, or creating summary tables that minimize per-user updates, you can often delay migration; otherwise, prioritize migrating high-write tables first.
⚠️ Warning: Hidden formulas, volatile functions, or many conditional format rules can multiply write costs and slow sheet operations; audit those before deciding whether to migrate.
How can Sheet Gurus API help prevent quota-related outages? 🛡️
Sheet Gurus API reduces direct Sheets API traffic and gives you operational controls to stop abusive or accidental spikes. The platform exposes per-key rate limits, configurable global throttles, and optional Redis caching so high-read workloads hit the cache instead of Google. Sheet Gurus API also queues and batches writes, provides idempotent endpoints to avoid duplicate writes, and surfaces detailed metrics you can wire into Cloud Monitoring or your SIEM to detect rising error rates. For teams that want to avoid building custom middleware, our no-code API flow (Connect → Configure → Ship) creates a production-ready endpoint with per-sheet permissions and API key management; see the no-code REST API guide and the API reference for endpoint examples and telemetry fields.
What are reliable thresholds to alert on before 429s start affecting users? ⏱️
Start with baseline-relative rate alerts and low-signal 429 alerts, then refine thresholds with controlled spike tests. A practical starting pair: 1) Alert when sustained request rate exceeds 40% above a 5-minute baseline for 3 minutes. 2) Alert on any 429 spike pattern such as more than 5 429 responses within 1 minute or an increase from zero to more than 2 429s in 5 minutes for low-volume services. Run controlled spike tests (simulate burst traffic from a test client) and record when retries or queuing begin to delay responses; use those results to tighten thresholds. Also add an alert for cache hit-rate drops if you use caching, since a sudden cache miss storm often precedes quota exhaustion. Sheet Gurus API emits request and cache metrics you can import to Cloud Monitoring to build these alerts and reduce false positives.
Stop quota outages with monitoring, limits, and a managed Sheets API.
You now have a practical path to diagnose 429s, surface quota hotspots, and put operational controls in place so errors stop interrupting pipelines. Follow the playbook to prioritize which API calls to prune and where to add short TTL caches, then bind those controls to Cloud Monitoring alerts and dashboards. For a full procedural checklist and quota calculator, see our playbook on increasing limits and preventing 429s.
If you want to skip building and maintaining middleware, try Sheet Gurus API to move a spreadsheet-backed workflow into production quickly. Sheet Gurus API turns Google Sheets into production-ready RESTful JSON APIs in minutes, requiring no backend code. Create your first endpoint or start a free trial on our site to test rate limits and alerting against real traffic.
💡 Tip: Alert on sustained 429 rates and per-key QPS instead of single spikes to avoid noisy paging.
For examples of production controls and no-code API patterns, see the no-code Google Sheets REST API guide and our API reference for endpoint examples and setup steps.